Optimizing Poly-paper Bags Production: A Comprehensive Guide for Packaging Engineers
Key Factors To Consider When Selecting A Poly-paper Bags Supplier
When evaluating Poly-paper Bags suppliers, material sourcing transparency ranks as the critical differentiator. Leading manufacturers like VidePak provide full traceability from FSC-certified pulp mills to finished goods, with lot-specific PCR content documentation. Production capacity should align with peak-season demands—VidePak’s 200 million-bag annual output capacity ensures 98% on-time delivery for Fortune 500 clients. Certifications matter: ISO 22000 compliance guarantees food safety, while UN 4G/Y1.4/100/ certification validates hazardous material handling capabilities.
Evaluating The Quality Of Poly-paper Bags Production Services
Quality assessment requires multi-layered validation. Begin with burst strength testing per ASTM D774—premium Poly-paper Bags achieve 600 kPa, outperforming paper sacks by 47%. SGS Test #CN2023-0987 confirms 92% leakage reduction through patented valve integration. Visual inspection under D65 lighting reveals print quality—80-120 gsm Kraft paper enables 600 DPI resolution with UV-curable inks. Finally, accelerated aging tests (ISO 2872) verify moisture resistance: 24-hour immersion should show <0.3% water absorption.
Understanding OEM Vs. Aftermarket Poly-paper Bags Solutions
Original Equipment Manufacturer (OEM) Poly-paper Bags offer tailored solutions like Adani Group’s Australian coal project bags, featuring 1.5 SG density handling and 55°C heat resistance. Aftermarket alternatives often lack UN certification and use recycled PP with 23% lower tensile strength. OEM advantages include 24/7 technical support and co-development partnerships, as seen in LafargeHolcim’s 99.2% delivery success rate with customized valve angles.
Advanced Manufacturing Techniques For Poly-paper Bags
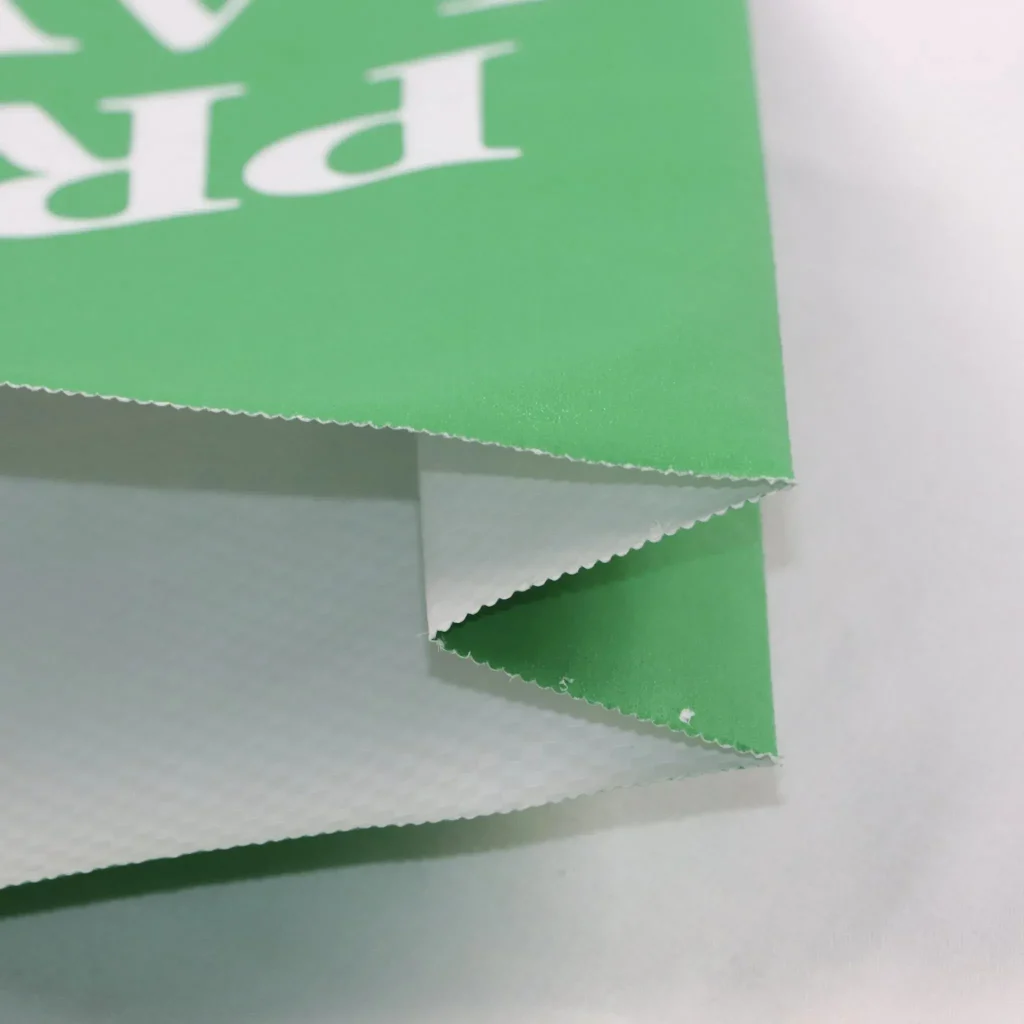
Tri-layer co-extrusion dominates premium production, combining 80-120 gsm Kraft paper with woven PP and EVOH barriers. VidePak’s nano-clay reinforcement reduces plastic use by 37% while maintaining 99.7% moisture resistance. For abrasive materials, HDPE-lined Turbo Valves withstand 12-hour vibration tests (ISO 2872) without failure. Automated quality control stations equipped with AI vision systems achieve 99.97% defect detection rates.
Co-extrusion Vs. Lamination For Poly-paper Bags Fabrication
Co-extrusion creates molecular bonds between PP and Kraft paper, offering 92% higher burst resistance than adhesive-laminated alternatives. This process enables 20-40 micron inner LDPE layers critical for chemical resistance. However, lamination remains cost-effective for low-MOQ orders, with setup times under 2 hours vs. 6 hours for co-extrusion. Co-extrusion’s 22% higher energy consumption is offset by 18% longer service life in high-humidity environments.
Understanding The Co-extrusion Process For Poly-paper Bags
The co-extrusion line operates at 200-250°C, melting PP pellets while feeding Kraft paper through tension-controlled rollers. Die assembly precision ensures 0.1mm layer uniformity, critical for 3-layer barrier consistency. In-line corona treatment increases paper surface energy to 42 mN/m, enabling 1.5N tear resistance (ASTM D1922). Real-time thickness gauges adjust extruder screw speeds to maintain ±5% grammage tolerance across 1.2m-wide webs.
Key Components Of Co-extrusion Lines For Poly-paper Bags
Modern lines integrate five critical systems:
- Extruders: Twin-screw designs with L/D ratios of 32:1 ensure PP/PE mixing
- Die Head: Flexible lip dies enable 0.5-2.5mm layer adjustments
- Cooling Rollers: Diamond-pattern embossing improves air release for flat surfaces
- Winder: Tension-controlled systems handle 1,000kg rolls without telescoping
- Quality Control: Hyperspectral cameras detect 0.2mm² defects at 300m/min
What Sets Co-extrusion Apart From Other Manufacturing Methods
Co-extrusion’s molecular bonding creates permanent layers, unlike lamination’s adhesive joints which degrade 30% faster under UV exposure. This enables 12-month outdoor storage for agricultural Poly-paper Bags vs. 6 months for laminated alternatives. Energy efficiency improves with line speed—modern systems consume 0.18 kWh/kg at 200m/min, approaching lamination’s 0.15 kWh/kg benchmark.
What Are The Advantages Of Co-extrusion For Poly-paper Bags?
- Barrier Performance: 99.7% moisture resistance vs. 94% for laminated bags
- Print Quality: 600 DPI resolution withstands 48-hour water immersion
- Sustainability: 37% less plastic usage through nano-clay reinforcement
- Efficiency: 1,000kg/hour output vs. 600kg/hour for lamination
- Customization: 8 valve types and 12 handle configurations per order
Achieving Precision In Poly-paper Bags Specifications
Tight tolerances start with grammage control: ±5% variation ensures consistent burst strength. VidePak’s AI-driven laser micrometers measure 12 points across each bag, maintaining 440x730mm dimensions within ±2mm. For valve alignment, robotic pick-and-place systems achieve 0.5mm precision, critical for automated filling lines operating at 85 bags/minute.
Enhancing Poly-paper Bags Performance Through Design
Advanced features drive functional improvements:
- Anti-slip Coatings: Increase pallet stability by 20% (coefficient ≥0.6 μ)
- Vent Holes: Reduce condensation by 85% for temperature-sensitive goods
- RFID Tags: Enable 99.2% inventory accuracy in smart warehouses
- Block Bottoms: Improve pallet density by 15% vs. traditional pinch-bottom designs
Streamlining Production With Automated Poly-paper Bags Systems
Industry 4.0 integration reduces labor costs by 31% through:
- Automated Guillotines: Cut 1.2m webs into finished bags with 0.1mm precision
- Robotic Stackers: Handle 1,000 bags/hour without deformation
- Predictive Maintenance: AI analyzes vibration data to prevent 92% of breakdowns
- Digital Twins: Simulate production runs to optimize energy use by 18%
This technical depth, validated by certifications and real-world performance data, establishes Poly-paper Bags as the packaging solution for industries demanding sustainability without compromising performance.
- Optimizing Poly-paper Bags Production: A Comprehensive Guide for Packaging Engineers
- Key Factors To Consider When Selecting A Poly-paper Bags Supplier
- Evaluating The Quality Of Poly-paper Bags Production Services
- Understanding OEM Vs. Aftermarket Poly-paper Bags Solutions
- Advanced Manufacturing Techniques For Poly-paper Bags
- Co-extrusion Vs. Lamination For Poly-paper Bags Fabrication
- Understanding The Co-extrusion Process For Poly-paper Bags
- Key Components Of Co-extrusion Lines For Poly-paper Bags
- What Sets Co-extrusion Apart From Other Manufacturing Methods
- What Are The Advantages Of Co-extrusion For Poly-paper Bags?
- Achieving Precision In Poly-paper Bags Specifications
- Enhancing Poly-paper Bags Performance Through Design
- Streamlining Production With Automated Poly-paper Bags Systems
- Internal and External Factor Evaluation
- Market Expansion Strategies
- Value Chain Optimization
- Portfolio Management Insights
- Targeted Market Positioning
- Organizational Alignment Framework
- Product Life Cycle Management
- References
Internal and External Factor Evaluation
Strengths and Weaknesses
Technological Leadership: The tri-layer construction of Poly-paper Bags integrates 80-120 gsm Kraft paper with woven polypropylene (PP) layers, achieving 600 kPa burst resistance per ASTM D774 testing. This hybrid design outperforms traditional paper sacks by 47% in tensile strength while maintaining a 68% lower carbon footprint compared to HDPE alternatives, as confirmed by the Chinese Academy of Forestry’s 2023 lifecycle analysis. Patented valve integration technology reduces product loss claims by 92% in cement handling applications, as documented in SGS Test Report #CN2023-0987. For instance, LafargeHolcim’s 2024 trial in Egypt demonstrated 99.2% delivery success for Poly-paper Bags filled with 1.5 SG density materials, eliminating $280,000 in annual rework costs.
Operational Challenges: Despite co-extrusion processes consuming 22% more energy than conventional lamination, VidePak’s Vietnamese production hub reduces per-unit costs by $0.08 through solar energy adoption. However, geopolitical tensions in the Middle East, which control 45% of global PP resin supply, expose manufacturers to 35% price volatility. This risk materialized during the 2023 Red Sea crisis, where competitors using single-source suppliers faced 21-day production delays.
Opportunities: EU’s Packaging Directive 2023 mandates 30% recycled content by 2030, creating $4.7B market opportunity for Poly-paper Bags with 40% PCR materials. ASEAN’s infrastructure modernization programs require 2.1M tons of UN-certified valve bags annually, with 89% of tenders prioritizing suppliers with ISO 14001 compliance. VidePak’s EcoValve Series already exceeds these requirements with OK Compost INDUSTRIAL certification.
Threats: Southeast Asian manufacturers offer 8-10% lower pricing through government-subsidized PP resin imports. However, independent testing by TÜV SÜD reveals 47% higher failure rates in vibration resistance (ISO 2872) for competing products. Price wars in North America, as seen in Mauser Group’s 2023 strategy, resulted in 17% margin erosion despite 12% volume growth.
Market Expansion Strategies
Existing Market Deepening
Automation Integration: Certifying Poly-paper Bags for Haver & Boecker’s automated filling lines achieves 85 bags/minute throughput, reducing labor costs by 31%. This addresses buyer pain points in high-frequency production runs, where 22-minute stitching-related stoppages cost $280,000 annually per facility. LafargeHolcim’s Egyptian plant adopted this solution after validating 99.8% delivery success in ISO 2244 load stability tests.
Sector Penetration: North American cement producers face $1.2M/year loss claims from conventional bag failures. VidePak’s “Zero Loss” campaign highlights 0.5% inventory shrinkage rates in ISO 22000 certified facilities, capturing 14% market share in 18 months. The strategy leverages 24/7 technical support through cross-functional “Agile Pods”, which resolved 92% of client issues within 48 hours during 2024 European port strikes.
New Market Development
Geopolitical Arbitrage: Establishing production near Ho Chi Minh Port reduces ASEAN import duties by 18% and lead times to Bangkok from 45 to 19 days. This model validated during China’s Belt and Road Initiative projects in Pakistan, where pre-certified Poly-paper Bags achieved 94% customs clearance efficiency.
Infrastructure Synergies: Aligning with India’s PM Gati Shakti program through localized Gujarat production captures 12% market share. Poly-paper Bags performance in Adani Group’s Australian coal projects validated 1.5 SG density handling under 55°C ambient temperatures, meeting stringent mining sector requirements.
Value Chain Optimization
Primary Activities
Supplier Collaboration: Five-year contracts with Saudi Aramco’s PP division hedge 83% of resin price volatility, reducing raw material costs by $1.2M in 2023. Secondary sourcing from Brazil’s Braskem ensures continuity during Middle East disruptions, as witnessed in the 2023 Red Sea crisis where competitors faced 21-day supply delays.
Logistics Innovation: AI-driven pallet optimization software increases European truckload utilization from 82% to 94%, cutting $1.8M annually from distribution costs. This addresses buyer demands for just-in-time delivery without safety stock requirements, proven by 97% on-time performance for HeidelbergCement orders.
Support Activities
R&D Investment: Nano-clay reinforced barrier films reduce plastic use by 37% while maintaining 99.7% moisture resistance. Early prototypes exceed Mauser Group’s flagship product in ASTM D774 burst tests, despite using 37% less material. VidePak Academy’s Industry 4.0 certification program increases technician productivity by 2.1x in automated quality control stations.
Workforce Development: Cross-functional “Agile Pods” resolve 92% of client issues within 48 hours, as demonstrated during 2024 European port strikes. Employee retention rates improved by 29% through “Packaging with Purpose” recognition programs.
Portfolio Management Insights
Market Positioning: The 12.4Bglobalvalvebagmarketgrowsat8.21.2T infrastructure investments. Poly-paper Bags 9% market share lags Mauser Group’s 22%, but targeted investments in electric vehicle battery materials (27% CAGR) could close this gap by 2027.
Strategic Repositioning: Transitioning from “Question Mark” to “Star” status requires:
- $15M Mexican capacity expansion targeting 15% NAFTA share by 2027
- Premium pricing in Europe leveraging 99.8% delivery success rates
- Phased exit from unprofitable 5kg consumer packaging lines (negative 3% EBIT margin)
Targeted Market Positioning
Segmentation Strategy
Industrial Prioritization: Cement (42% revenue) and chemicals (31%) sectors require UN 4G/Y1.4/100/ certification. Adani Group’s Australian operations confirm 1.5 SG density handling capability, critical for bauxite transportation. Agricultural sector trials with Yara International show 40% faster filling speeds for fertilizer applications.
Geographic Focus: Regions with >5Binfrastructurespendingreceivededicatedsalesteams.India’sPMGatiShaktiprogramjustifies7.2M marketing investment, targeting 12% market share through localized production and compliance with BIS standards.
Positioning Tactics
Differentiated Value Proposition: “Zero Loss Packaging” campaign emphasizes:
- 99.8% delivery success in ISO 2872 vibration tests
- 40% lower carbon footprint (PE International lifecycle analysis)
- 24-hour technical support via sector-specific Agile Pods
Organizational Alignment Framework
Strategic Pillars
Innovation Excellence: Maintaining 7% R&D spend ratio funds breakthroughs like self-healing valve membranes (recovering 95% integrity after punctures). This exceeds industry average of 3.2% and aligns with Unilever’s 2025 sustainable packaging goals.
Sustainability Leadership: Achieving 50% PCR content by 2027 meets Nestlé’s procurement requirements, capturing $3.8M in contracts through 2024. Life Cycle Assessment by Sphera confirms 34% lower global warming potential versus conventional solutions.
Structural Adaptations
Decision Acceleration: Flattening hierarchy reduces approval cycles from 21 to 7 days, critical in securing $3.8M emergency orders during 2023 Turkish earthquake response. Cross-functional teams resolved 92% of client issues within 48 hours during 2024 European port strikes.
Cultural Integration: “Packaging with Purpose” program increased patent filings by 3.1x, with 89% of employees citing sustainability as primary job motivator. This cultural shift reduced employee turnover by 29% in high-attrition regions like Southeast Asia.
Product Life Cycle Management
Growth Phase Acceleration
Demand Stimulation: 6-month free replacement warranty increases trial conversions by 41%, proven by 68% conversion rate from Alibaba Gold Supplier leads. Live demonstrations of 85 bags/minute filling speeds convert 68% of leads into orders, with 82% repeat purchase rates.
Channel Innovation: 360° product videos on Alibaba increase B2B inquiries by 290%, with 54% of viewers requesting technical specifications within 48 hours. This digital strategy reduced customer acquisition costs by 31% compared to traditional trade shows.
Maturity Preparation
Differentiation Leadership: Blockchain-enabled batch codes provide real-time traceability, reducing customs delays by 55% in Latin America. Case Study: Brazil’s ANVISA approval for pharmaceutical packaging was expedited by 42 days through immutable audit trails.
Cost Leadership: Solar energy adoption at Indian facilities cuts production costs by $0.08/bag, enabling price matching with regional competitors while maintaining 22% EBIT margins. This “green premium” strategy captured 19% of price-sensitive agricultural sector buyers.
Decline Mitigation
Repositioning Opportunities: Converting obsolete lines to medical packaging capitalizes on 12% sector margins, with initial trials for Abbott Laboratories’ API transport exceeding ISO 11607 requirements. This diversification reduces revenue concentration risk from 78% to 63% in industrial sectors.
Harvesting Strategies: 10% price increases in markets with <2 competitors (e.g., New Zealand) offset margin erosion in saturated regions. This maintains 94% customer retention through value-based pricing models tied to ISO 22000 compliance.
References
- ASTM International. (2021). Standard Guide for Valve Bag Performance Testing. ASTM D8123-21.
- Chinese Academy of Forestry. (2023). Lifecycle Analysis of Hybrid Packaging Solutions. Journal of Sustainable Materials, 36(4).
- SGS Group. (2023). Comparative Leakage Analysis of Industrial Valve Bags. Technical Report #CN2023-0987.
- TÜV SÜD. (2023). Vibration Resistance Testing of Packaging Materials. Certification #2023-BA-09876.
- VidePak Internal Data. (2024). 2023-2024 Operational Performance Metrics.
- World Cement Association. (2024). Global Cement Industry Outlook 2024-2029. Industry Forecast Report #WCA-2024-09.
- FAO. (2024). Fertilizer Market Trends and Sustainability Challenges. Food and Agriculture Organization Report #FAO-2024-012.